Inflation: Transitory or Purgatory? – Fort Pitt Capital Group Quarterly Commentary
While most major equity indices finished the quarter in negative territory, the S&P 500 Index eked out a 0.6% gain, just good enough for its sixth consecutive positive quarter. The path of least resistance remained higher for the better part of the third quarter, driven by a continued focus on easy financial conditions, accommodative monetary policy, impressive corporate earnings growth, resilient profit margins, and rising shareholder returns. However, sentiment deteriorated in September as more persistent supply chain and input price pressures dented the “transitory” inflation narrative. In addition, the deep partisan division over how to raise the debt ceiling and more explicit hints from the Federal Reserve on their near-term tapering plans did little to boost investor risk appetite.
Despite elevated inflation concerns, interest rates were only up marginally in the quarter. As a result, most bond market segments posted flattish returns with the intermediate-maturity Bloomberg U.S. Aggregate Bond Index advancing by 0.1%.
Below is a summary of third quarter performance results for several major indices:
| Asset Class | Index | Q3 Return | ||||
| U.S. Stocks | S&P 500 Index | 0.58% | ||||
| International Stocks | MSCI EAFE Index | -0.45% | ||||
| Global Stocks | MSCI ACWI Index | -1.05% | ||||
| Municipal Bonds | Bloomberg Municipal 5-10 Yr. Bond Index | -0.04% | ||||
| Taxable Bonds | Bloomberg Credit 1-5 Yr. Bond Index | 0.09% | ||||
Third quarter economic data was negatively skewed by the Delta driven flare-up that dampened economic reopening momentum. These headwinds translated into slowdowns in air travel, dining out and other service-related activities. Unsurprisingly, the declines in consumer confidence readings and hiring activity were highly correlated with rising case counts throughout July and August. However, with the cases peaking in early September, it’s reasonable to expect a rebound in consumer and business confidence as well as a re-acceleration in consumer spending as cases trend lower. And economic data showed some evidence of improvement by late September.
Inflation concerns, more persistent supply chain disruptions, and labor shortages continue to dominate both the macro and corporate narratives. These concerns have been exemplified by profit warnings from numerous companies across a broad swath of industries as well as recent comments from Federal Reserve Chairman Jerome Powell that inflationary pressures are larger and longer-lasting than they had anticipated.
With headline inflation (Consumer Price Index) levels hovering around 13-year highs, we wanted to outline some of the underlying contributors to the outsized price gains and provide some thoughts on potential near-term outcomes.
Base effects – The significant declines for various commodities, products, and services early in the onset of the pandemic have resulted in unusually low reference points for year-over-year price comparisons and, correspondingly, extraordinarily high growth rates. However, these dynamics will fade as price changes are compared to more normalized levels.
Supply chain disruptions – Supply-demand mismatches have also been a key contributor to rising input costs.
Earlier this year, the huge spike in lumber prices gained a lot of attention and represented a good example of how supply chain bottlenecks can temporarily distort prices. Lumber prices increased by about 400% from the spring of 2020 through May of 2021. Part of the spike in prices can be explained by the surge in demand for new homes and home improvement projects. But the other part of the equation was labor shortages to source and transport the lumber as well as capacity constraints at lumber mills. Lumber prices have since declined by more than 60% as supply chain pressures subsided.
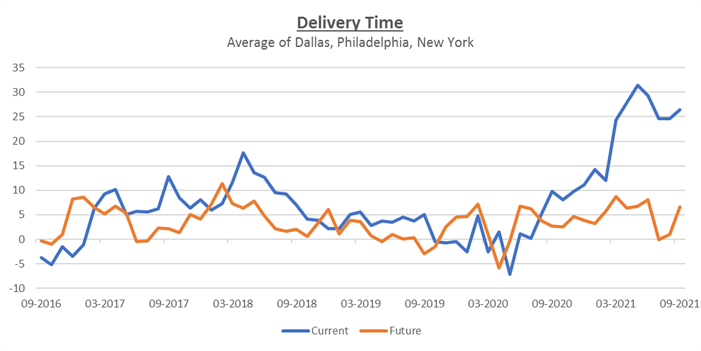
Data and commentary from a broad group of suppliers and purchasing managers suggest that supply chain disruptions won’t be resolved immediately, but the end may be in sight. The chart below shows supplier delivery times which reflect the delay in supply chains. While current delivery times are near record levels, expectations for future delivery times have trended back to their typical range. Manufacturers are anticipating supply shortages and supply chain disruptions to subside over the next six months.
Source: Federal Reserve
Fiscal stimulus – Surging consumer demand has also contributed heavily to higher prices. However, consumer spending power was turbocharged by three rounds of stimulus checks and extremely generous enhanced unemployment benefits. But, now that most of the fiscal stimulus has run its course (we think) and with household savings rates returning to pre-pandemic levels, it will be more challenging for consumers to turn in a repeat performance going forward.
Monetary policy – It’s very reasonable for investors to expect the Federal Reserve’s +$4 trillion (and counting) Quantitative Easing (“QE”) program to result in inflation. The same assumption was made about the monetary response to the Financial Crisis and an inflationary outcome never occurred. In both instances, most of the Fed’s liquidity has ended up sitting idle in bank reserves. So far, the excess liquidity has not been recycled through the real economy or used to facilitate aggressive credit growth. In fact, the amount of outstanding loans has actually declined over the past 14 months.
The Fed has given a strong indication of their intentions to start tapering their aggressive bond purchases in the coming months and many economists and market pundits believe they could completely wind down their QE program by the middle of 2022. A look back at the three prior QE cycles shows that inflation measures declined following the conclusion of each asset purchase program.
We have also not forgotten about the longer-term structural factors that have kept inflation in check for decades. A shortlist includes – poor demographic trends, low population growth, globalization, and technical innovations/automation. While there have been some changes at the margin in a number of these categories, none of these trends have reversed course.
Time will tell if elevated inflation levels prove to be transitory or longer-lasting. It’s difficult to make hard and fast conclusions given the completely unprecedented fiscal and monetary responses to the pandemic. So far, strong demand has allowed corporations to pass along higher input costs to end customers, evidenced by S&P 500 companies achieving record-high profit margins in the second quarter. Any combination of weakening demand and longer-lasting price pressures jeopardize elevated profit margins. We will be closely monitoring these dynamics going forward.
S&P 500 Profit Margins
Quarterly Operating Earnings/Sales
Source: BEA, CompStat, FactSet, Standard & Poor’s, J.P. Morgan Asset Management.
Guide to the Markets – U.S. Data are as of September 30, 2021.
|


