
Quarterly Commentary July 2022

Balancing Act
Equity markets declined sharply in the second quarter, with the S&P 500 Index falling by 16.1%. When combined with the negative equity market returns in the first three months, the broad market has suffered its worst first half since the Nixon administration. Selling pressure was driven by a host of factors but could be more narrowly attributed to another leg higher in interest rates, stubbornly high inflation, and the Federal Reserve’s more aggressive policy stance. All of which are occurring against the backdrop of a rapidly slowing economy.
It was also another tough quarter for bonds. Bond markets were rattled by the Federal Reserve’s outsized interest rate hikes and their more hawkish rhetoric as the Fed emphasized their pledge to combat inflation. The intermediate-maturity U.S. Bloomberg Aggregate Bond Index declined by 4.7%, while longer-maturity and more credit-sensitive fixed income benchmarks fared even worse.
Interest rates have risen aggressively in a short period. For example, 10-year Treasury bond yields doubled in the first six months of the year. This spike in interest rates has translated into significantly lower bond prices. Not to discount the damage the bond market has undergone, but going forward, much higher bond yields can contribute mightily to long-term returns for fixed income portfolios. From these levels, bonds look more attractive than they have in quite a while.
As we have discussed previously, inflation will be the linchpin for near-term outcomes for the economy and financial markets. If inflationary pressures remain elevated, it forces the Fed’s hand to continue their aggressive interest rate hiking cycle, which increases the risks of a policy mistake/recession. If inflation starts to fade, it may allow the Fed some flexibility and the ability to take a more patient approach. The Fed may not need to raise short-term interest rates as high as currently projected if demand moderates and prices cool.
While there has been no moderation in the backward-looking inflation reports, our more real-time internal research indicates inflationary pressures are starting to ease. The list includes:
- Cooling off in housing starts as well as new and existing homes sales as mortgage rates have spiked to around 6%.
- Global shipping rates and domestic freight costs have started to decline.
- Retailers are no longer scrambling for inventory to stock the shelves. Instead, many retailers are now holding too much inventory and discounting merchandise to clear the glut.
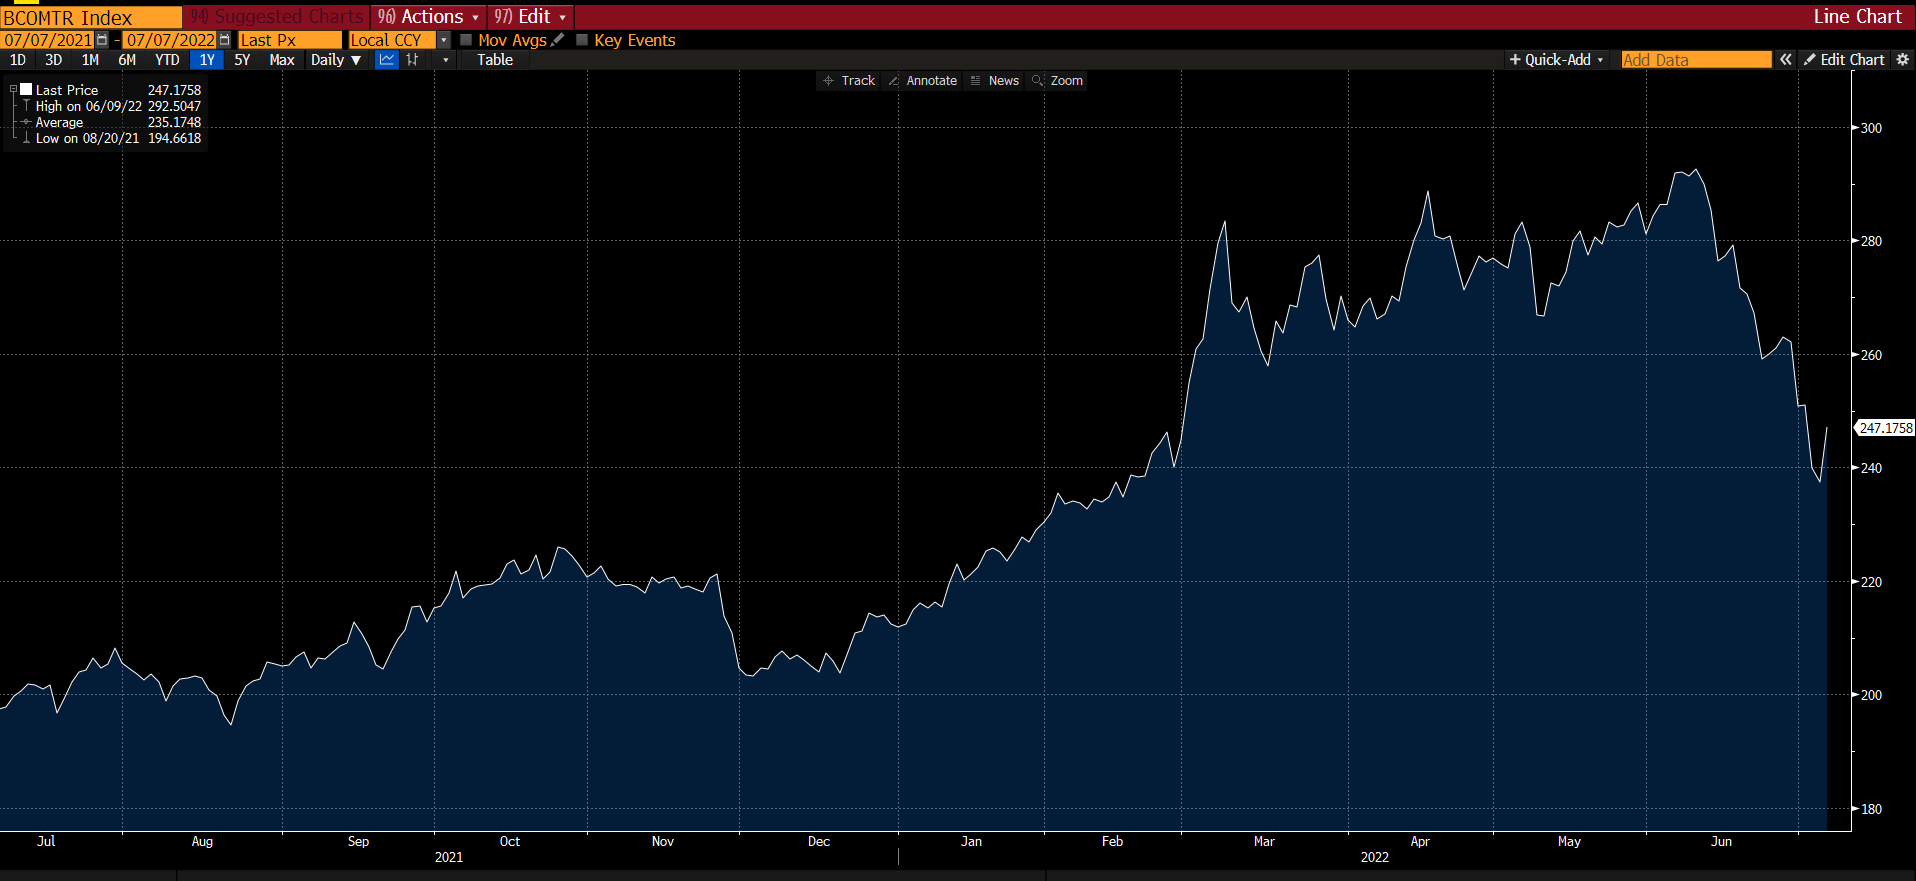
- Commodity prices have been in sharp retreat since the mid-June highs. The chart below shows the recent pullback in a commodity index which includes precious and industrial metals, agricultural commodities as well as energy.
Bloomberg Commodity Index Total Return 07/07/2021 – 07/07/2022
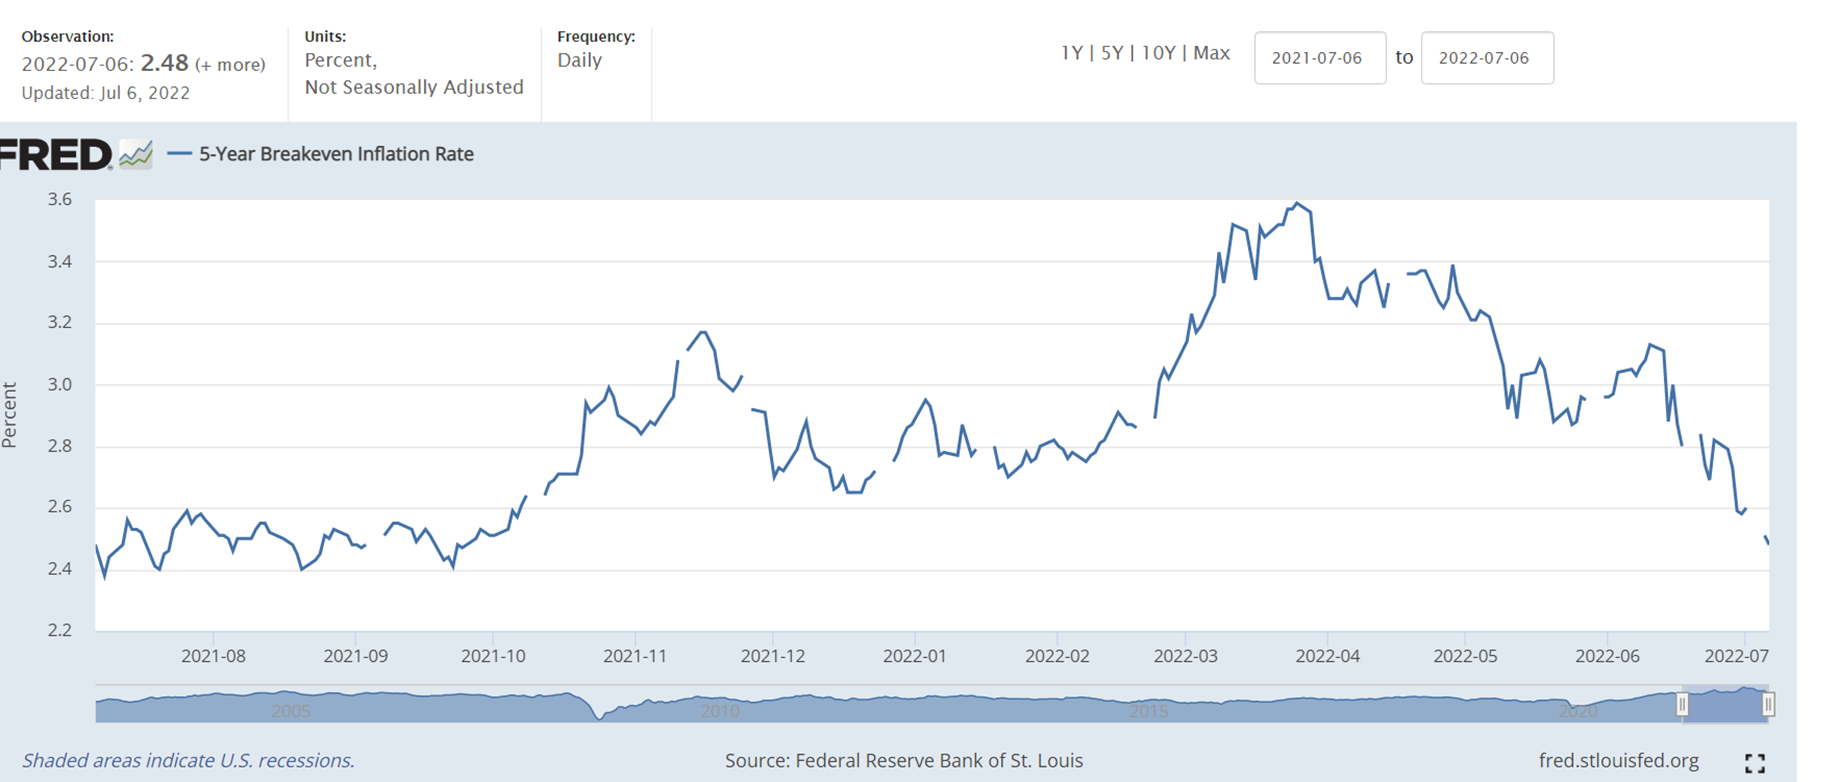
While the debate among economists continues over how long inflation will stay elevated, market-based inflation expectations have declined dramatically since the late-March peak. The chart below shows 5-year breakeven rates, or, in simpler terms, a proxy for the bond market’s expectation for the average inflation rate over the next five years. The markets believe that the Fed will win the fight against inflation.
5-Year Breakeven Inflation Rate 07/06/2021 – 07/06/2022
While we welcome the signs of moderating inflation, we also recognize that a rapidly slowing economy and softer demand have been key contributors to the equation. In fact, our economy may already be in at least a technical recession with a negative GDP print in the first quarter and estimates for another negative reading for the second quarter. While that outcome might not meet everyone’s definition of a recession, it’s close enough to provide some thoughts on a recessionary outcome.
Our banking system is well-capitalized. Consumers have strong and underleveraged balance sheets. And large corporations are well-positioned after significant capital raises in 2020 and years of healthy profits. If we are amid an economic contraction, or it is on the horizon, these factors should help mitigate the severity.
Also, looking back at the past dozen or so post World War II recessions, the median broad market (S&P 500 Index) decline has been 24%. We have already experienced a drawdown in-line with these historical averages. That data point doesn’t tell us that the bottom is in, or stocks couldn’t decline more. But it indicates that a lot of bad news and negative outcomes have been priced in.
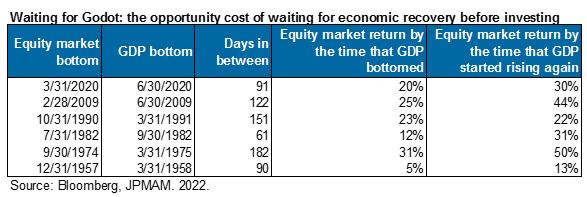
We will close with the most important point. The market is forward-looking and tends to bottom well before all the bad economic data and negative headlines go away. A look at the previous six recessions provides a solid illustration of that point. On average, the equity market bottomed almost 4 months before GDP bottomed, stocks were up 19% before GDP bottomed, and up by 31% by the time that the economy started to grow again.
Investors that attempt to “time” the market in order to avoid bouts of volatility often fail to adequately account for the forward-looking nature of markets and end up on the sidelines when markets recover. While not always comfortable, leveraging long investment time horizons and adhering to well-established investment plans have proven to be successful strategies for navigating periods of market volatility. We feel this time will be no different.
